We present a new interactive data tool: ‘By the Numbers: Latinos in the Time of Coronavirus’

Since March 2020, the COVID-19 pandemic has devastated Latino communities across the country, leaving physical, emotional, and economic destruction in its path. Producing accurate, accessible data on the pandemic’s impact on Latino communities is critical not only to documenting and understanding its course, but also to achieving an inclusive, equitable recovery. To this end, UnidosUS is pleased to present the data tool, “By the Numbers: Latinos in the Time of Coronavirus,” an interactive, user-friendly dashboard that provides the latest data on the effects of COVID-19 across a range of issues. It is our hope that this tool will help users—advocates, journalists, policymakers, researchers, and others—better understand issues facing Latino communities in the time of COVID-19.
The dashboard, designed by the Population Reference Bureau, provides trends both nationally and in six key states with large Latino populations (Arizona, California, Florida, Nevada, Texas, and Colorado). Using data from the U.S. Census Bureau’s experimental Household Pulse Survey, we display bi-weekly data with race/ethnicity comparisons for the following indicators:
- Loss of Employment Income
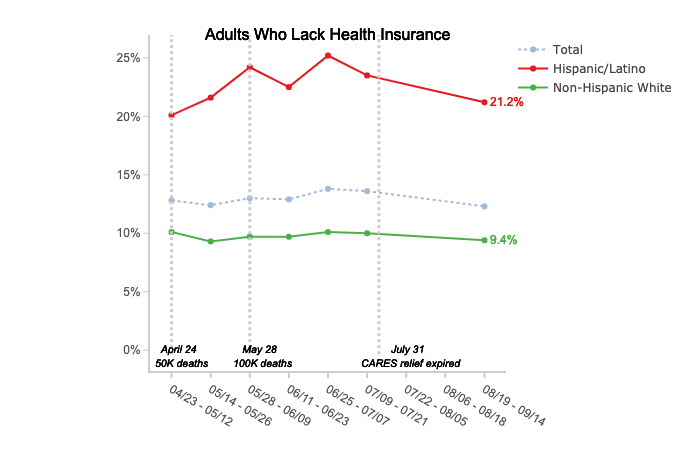
- Health Insurance Coverage (Overall/Public/Private)
- Food Insufficiency
- Mental Health (Anxiety)
- Housing (Missed Rent or Mortgage Payments)
- Educational Changes (Classes Cancelled or Moved to Distance Learning)
- Access to Technology for K-12 Education (Computers or Internet)
A unique feature of the dashboard is that it also allows viewers to see what the course of the pandemic will look like for Latinos in the months to come, depending on how well each state is able to contain community spread through preventive measures such as masking and physical distancing. The projection graphs provide pandemic-related case and mortality projections through the end of 2021 for the six states and will be updated periodically as new data become available. We will be adding non-health related projections (for example, economic well-being indicators) in the weeks to come.
The dashboard is easy to use, with a drop-down menu and hover-over features. Both the graphs and raw data can be downloaded in different formats for optimal use. Detailed information about specific indicators, methods, projection calculations, and recommended citations are available through the tabs at the top of the dashboard’s home page.
This data tool is free to the public as part of UnidosUS’s data-driven research and analysis on the pandemic’s impact on Latino communities and the need for an inclusive government response. (See below for select reports, town halls, and other analyses.) We invite you to click through By the Numbers: Latinos in the Time of Coronavirus, browse the various trends and projections, and download customized data or graphs!
For more information on the impact of the coronavirus on the Latino community, please see:
- Report: The Latino Community in the Time of Coronavirus: The Case for a Broad and Inclusive Government Response
- Conversation: UnidosUS talks to Senator Catherine Cortez Masto and Representative Joaquin Castro on the Impact of COVID-19 on Latinos
- Analysis: The Latino Community in the Time of Coronavirus: Still Waiting for a Government Response
- Brief: Struggling to Stay Home: Latino Renters in the COVID-19 Pandemic